This is a function to make a dotplot from a caretStack. It uses dotplot from the caret package on all the models in the ensemble, excluding the final ensemble model.At the moment, this function only works if the ensembling model has the same number of resamples as the component models.
Examples
set.seed(42)
models <- caretList(
x = iris[1:100, 1:2],
y = iris[1:100, 3],
methodList = c("rpart", "glm")
)
#> Warning: There were missing values in resampled performance measures.
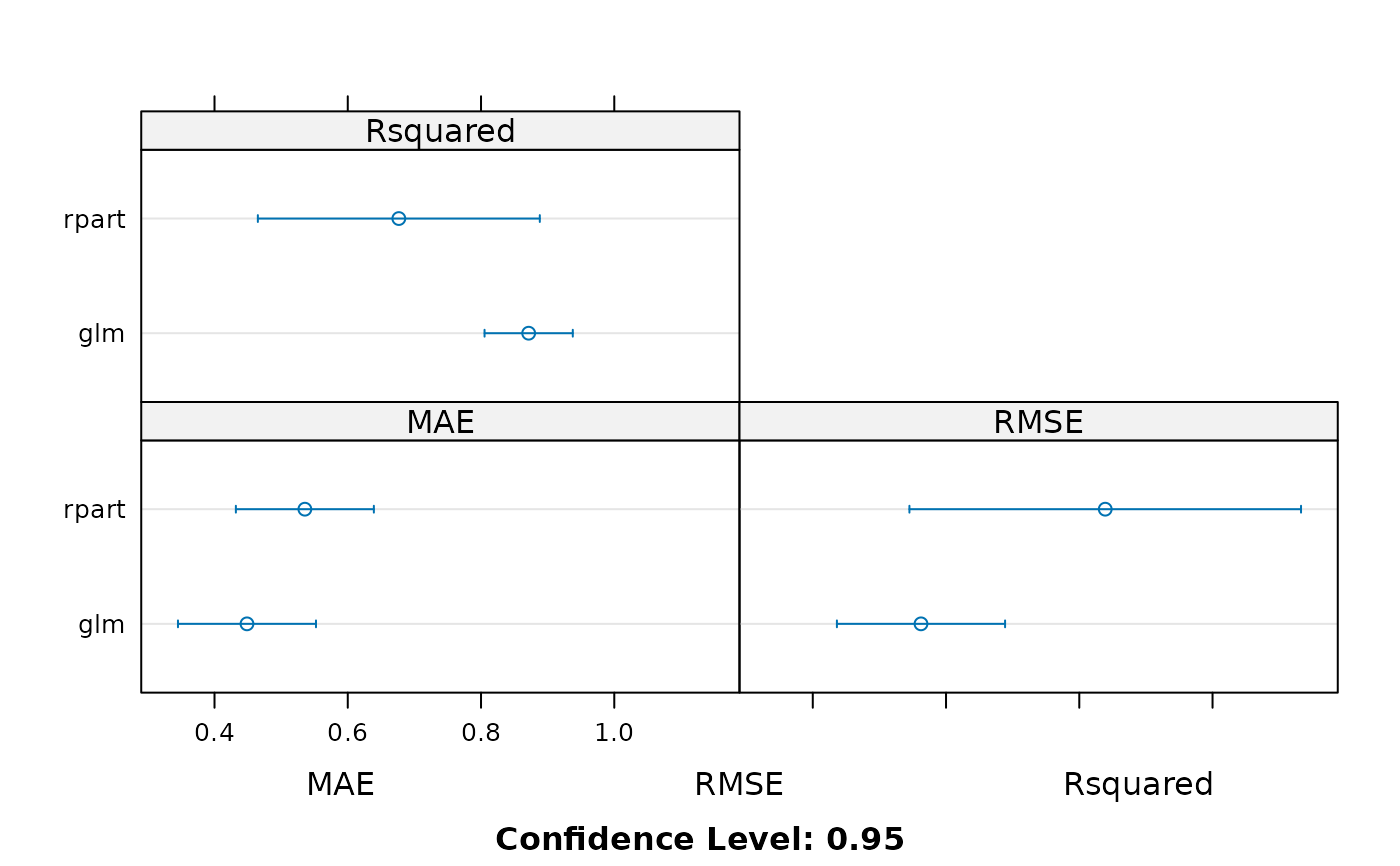
meta_model <- caretStack(models, method = "lm")
lattice::dotplot(meta_model)